The VR School
Financial LiteracyGive
Enroll
STAT
All Courses
UC A-G Section CMathematicsWASC AccreditedHonors Course

Statistics / Honors Data Analysis
Think With Data

Data, Inference, Decisions

The most comprehensive agentic Honors Statistics course. From exploring data to statistical inference — master every analysis type, develop data science skills, and communicate findings with confidence — guided by Prof. Nadia Osei and SofAI.

Start with Prof. Nadia
All Courses
📊
Honors
Course Structure

Four Course Pillars

📊
Describe · Compare · Visualize

Exploratory Data Analysis

25%
  • › Categorical vs. quantitative variables and graphical displays
  • › Describing distributions using SOCS: Shape, Outliers, Center, Spread
  • › Scatterplots, correlation, and bivariate data patterns

Prof. Nadia's Tip: For every distribution, describe SOCS in order: Shape, Outliers, Center, Spread. Always include context — say 'commute times' not just 'values.'

🎲
Rules · Random Variables · Normal

Probability & Distributions

25%
  • › Basic probability rules and conditional probability
  • › Binomial and geometric distributions
  • › Central Limit Theorem and sampling distributions

Prof. Nadia's Tip: Name your distribution before calculating. 'X follows a Binomial distribution with n = 10, p = 0.4' earns the setup point before any computation.

🎯
Confidence Intervals · Significance Tests

Statistical Inference

30%
  • › Confidence interval structure: statistic ± critical value × SE
  • › Four-step hypothesis test: Hypotheses, Conditions, Calculations, Conclusion
  • › z-tests, t-tests, and chi-square tests of independence

Prof. Nadia's Tip: Always define your parameter first: 'Let p = the true proportion of all students who…' Then check Random, Normal, Independent conditions before calculating.

📈
LSRL · Residuals · Inference for Slope

Regression & Association

20%
  • › Least-squares regression line and interpreting slope and intercept
  • › Residuals and residual plots for checking linearity
  • › r² interpretation and inference for regression slope

Prof. Nadia's Tip: When interpreting slope: 'For each additional [x-unit], the predicted [y-variable] increases/decreases by [slope] [y-units] on average.' Always in context.

What You Will Build

Four Mastery Areas

Honors Statistics develops four interconnected skill sets that form the foundation of data science, research, and quantitative reasoning at the college level.

🧠
Statistical Thinking

Frame questions statistically, distinguish causation from association, and recognize when data supports a claim.

📉
Data Visualization

Create and interpret histograms, boxplots, scatterplots, and two-way tables to reveal patterns in data.

🎲
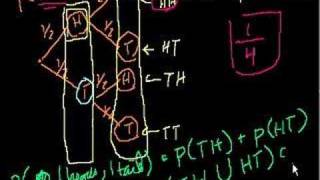
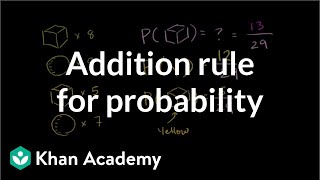
Probability Reasoning

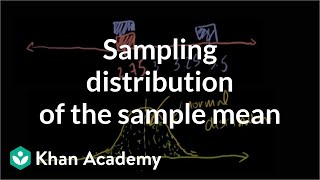
Apply probability rules, model random phenomena with distributions, and use the Normal curve fluently.

🔬
Inference Skills

Construct confidence intervals, conduct significance tests, and communicate conclusions in context with evidence.

Honors Course Goals

Skills and outcomes you will demonstrate

📊

Describe and compare distributions using the full SOCS framework in every analysis

🎲

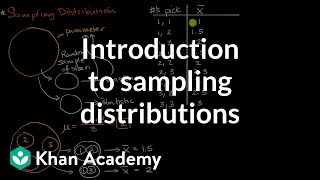
Apply probability rules and distributions to model real-world random phenomena

🔬

Conduct complete inference procedures with conditions checked and conclusions in context

✏️

Communicate findings in writing — every statistical claim supported by evidence and context

Full Curriculum

Eight Statistics Units

📊
UNIT 115-23%

Exploring One-Variable Data

Expand ›

Key Topics

  • Categorical vs. quantitative variables
  • Describing distributions: shape, center, spread, outliers (SOCS)
  • Measures of center: mean, median; measures of spread: range, IQR, standard deviation
  • Boxplots, histograms, dotplots, stemplots; comparing distributions

Key Terms

distribution
pattern of values: shape, center, spread of a variable
IQR
interquartile range = Q3 - Q1 (middle 50% spread)
outlier
value more than 1.5×IQR beyond Q1 or Q3
skewed right
tail extends to the right; mean > median
standard deviation
typical distance of values from the mean
z-score
number of standard deviations a value is from the mean: z = (x - μ)/σ
Practice Prompt

A dataset shows commute times (in minutes) for 20 workers: 12, 15, 18, 20, 20, 22, 25, 25, 28, 30, 30, 32, 35, 40, 45, 50, 55, 60, 75, 90. Calculate the mean, median, Q1, Q3, and IQR. Identify any outliers. Describe the distribution using SOCS. Would you use mean or median to describe center? Justify.

Practice with Prof. Nadia →

Curated Video Lessons

Describing Distributions — AP Statistics
content

Describing Distributions — AP Statistics

Starnes AP Stats12 min
Boxplots and Histograms
visual

Boxplots and Histograms

Khan Academy10 min
Mean vs. Median — When to Use Which
concept

Mean vs. Median — When to Use Which

AP Stats Guy8 min
📈
UNIT 25-7%

Exploring Two-Variable Data

Expand ›

Key Topics

  • Scatterplots: direction, form, strength, outliers
  • Correlation coefficient r: strength and direction (-1 to 1)
  • Least-squares regression line: ŷ = a + bx
  • Residuals = observed - predicted; residual plots for linearity check
  • Influential points vs. outliers in regression

Key Terms

correlation (r)
measures strength and direction of linear association (-1 to 1)
least-squares regression
line that minimizes sum of squared residuals
residual
observed y minus predicted ŷ
extrapolation
predicting outside the range of data (unreliable)
lurking variable
third variable causing the association between two others
coefficient of determination r²
% of variation in y explained by linear relationship with x
Practice Prompt

A researcher finds r = 0.87 between hours studied and test score. Write 3 correct interpretations of this r value. Then: what is r²? What does it mean in context? If the LSRL is ŷ = 42 + 5.3x (where x = hours studied), predict the test score for a student who studied 8 hours. A student studied 8 hours and scored 78. Calculate and interpret their residual.

Practice with Prof. Nadia →

Curated Video Lessons

Scatterplots and Correlation
content

Scatterplots and Correlation

AP Stats Guy11 min
LSRL — Least Squares Regression
content

LSRL — Least Squares Regression

Khan Academy AP Stats13 min
Residuals and Residual Plots
application

Residuals and Residual Plots

Starnes AP Stats9 min
🔬
UNIT 312-18%

Collecting Data

Expand ›

Key Topics

  • Census vs. sample; sampling methods (SRS, stratified, cluster, systematic)
  • Sources of bias: voluntary response, convenience, undercoverage, nonresponse
  • Observational studies vs. experiments
  • Experimental design: treatments, control, random assignment, placebo, double-blind
  • Confounding variables and how to control them

Key Terms

SRS
simple random sample — every individual has equal chance of selection
stratified random sample
divide into strata, then SRS from each stratum
confounding variable
variable that is related to both the explanatory and response variables
control group
group that receives no treatment (or placebo)
random assignment
randomly assigning subjects to treatments — eliminates confounding
double-blind
neither subjects nor evaluators know who received which treatment
Practice Prompt

A school wants to know if students prefer online or in-person learning. (a) Describe how to conduct a stratified random sample by grade level with n=120. (b) A student suggests using a voluntary response survey posted on the school website. Explain two sources of bias this introduces. (c) Design a randomized comparative experiment to test whether online tutoring improves test scores compared to in-person tutoring. Include: subjects, treatments, random assignment, and response variable.

Practice with Prof. Nadia →

Curated Video Lessons

Sampling Methods — AP Statistics
content

Sampling Methods — AP Statistics

AP Stats Guy12 min
Experimental Design
content

Experimental Design

Khan Academy AP Stats11 min
Bias in Surveys — AP Stats
application

Bias in Surveys — AP Stats

Starnes AP Stats8 min
🎲
UNIT 410-20%

Probability

Expand ›

Key Topics

  • Basic probability rules: P(Aᶜ), P(A or B) = P(A) + P(B) - P(A and B)
  • Conditional probability: P(A|B) = P(A and B)/P(B)
  • Independent vs. mutually exclusive events
  • Venn diagrams and two-way tables
  • Law of Large Numbers and the Multiplication Rule

Key Terms

sample space
set of all possible outcomes
complement
P(Aᶜ) = 1 - P(A)
mutually exclusive
events that cannot both occur: P(A and B) = 0
independent events
P(A|B) = P(A): knowing B doesn't change probability of A
conditional probability
P(A|B) = P(A and B) / P(B)
Bayes' theorem
P(A|B) = P(B|A)·P(A) / P(B)
Practice Prompt

In a survey of 200 students, 120 play a sport and 80 are in band. 40 do both. (a) Create a two-way table. (b) Find P(Sport and Band), P(Sport or Band), P(Sport|Band), P(Band|Sport). (c) Are playing a sport and being in band independent? Show your work mathematically. (d) If 3 students are randomly selected without replacement, what is the probability all 3 play a sport?

Practice with Prof. Nadia →

Curated Video Lessons

Probability Rules — AP Statistics
content

Probability Rules — AP Statistics

AP Stats Guy10 min
Conditional Probability and Independence
content

Conditional Probability and Independence

Khan Academy AP Stats12 min
Two-Way Tables and Conditional Probability
practice

Two-Way Tables and Conditional Probability

Starnes AP Stats9 min
📉
UNIT 57-12%

Random Variables and Probability Distributions

Expand ›

Key Topics

  • Discrete random variables: mean (μ), standard deviation (σ)
  • Continuous random variables and the Normal distribution
  • Binomial distribution: n trials, probability p of success, X ~ B(n,p)
  • Geometric distribution: number of trials until first success
  • Linear combinations of random variables: E(aX + b), Var(aX + b)

Key Terms

expected value E(X)
mean of a probability distribution: Σx·P(x)
binomial distribution
counts successes in fixed n independent trials with constant p
geometric distribution
counts trials until first success
Normal distribution
symmetric bell curve defined by μ and σ
standardizing
z = (X - μ)/σ — converts to standard normal
10% condition
sample < 10% of population — allows treating as independent
Practice Prompt

A student guesses on a 10-question true/false quiz. Let X = number correct. (a) Describe the distribution of X. (b) Find P(X ≥ 7). (c) Find the mean and standard deviation of X. (d) Now assume the quiz has 100 questions. What is the approximate probability the student gets more than 60 correct? Use the Normal approximation (check conditions first).

Practice with Prof. Nadia →

Curated Video Lessons

Discrete Random Variables — Expected Value
content

Discrete Random Variables — Expected Value

AP Stats Guy11 min
Binomial Distribution — AP Statistics
content

Binomial Distribution — AP Statistics

Khan Academy AP Stats14 min
Normal Distributions and Z-Scores
visual

Normal Distributions and Z-Scores

Starnes AP Stats12 min
📐
UNIT 67-12%

Sampling Distributions

Expand ›

Key Topics

  • Sampling distribution of x̄: mean = μ, SD = σ/√n
  • Central Limit Theorem: x̄ approximately Normal when n ≥ 30
  • Sampling distribution of p̂: mean = p, SD = √(p(1-p)/n)
  • When to use z vs. t: known σ → z; unknown σ (use s) → t
  • Standard error vs. standard deviation

Key Terms

sampling distribution
distribution of a statistic over all possible samples of same size
Central Limit Theorem
x̄ is approximately Normal for large n, regardless of population shape
standard error
standard deviation of a sampling distribution
p̂ (p-hat)
sample proportion = count of successes / n
unbiased estimator
statistic whose mean equals the population parameter
variability
spread of a sampling distribution — decreases as n increases
Practice Prompt

The heights of adult women are Normally distributed with μ = 64 inches and σ = 2.8 inches. (a) What is the probability that one randomly selected woman is taller than 67 inches? (b) What is the sampling distribution of x̄ for samples of size n = 25? (c) What is the probability that the mean height of 25 women exceeds 65 inches? (d) If instead of height, we measured a heavily skewed variable (income), would the CLT still apply for n = 25? For n = 100? Explain.

Practice with Prof. Nadia →

Curated Video Lessons

Sampling Distributions — AP Statistics
content

Sampling Distributions — AP Statistics

AP Stats Guy13 min
Central Limit Theorem
concept

Central Limit Theorem

Khan Academy AP Stats10 min
Standard Error vs. Standard Deviation
clarification

Standard Error vs. Standard Deviation

Starnes AP Stats8 min
🎯
UNIT 712-15%

Inference: Confidence Intervals

Expand ›

Key Topics

  • Confidence interval structure: statistic ± critical value × SE
  • One-sample z-interval for proportion; one-sample t-interval for mean
  • Two-sample intervals: comparing two groups
  • Interpreting: 'We are 95% confident that the true [parameter] is between...'
  • Conditions: Random, Normal/Large Sample, Independence (10% condition)

Key Terms

confidence interval
range of plausible values for a population parameter
confidence level
probability that the interval captures the true parameter in repeated sampling
margin of error
critical value × standard error
critical value
z* or t* corresponding to desired confidence level
t-distribution
used when σ is unknown; heavier tails than Normal
degrees of freedom
df = n - 1 for one-sample t; determines t* value
Practice Prompt

A random sample of 50 students showed that 34 have a smartphone. (a) Check all conditions for a one-proportion z-interval. (b) Calculate a 95% confidence interval for the true proportion of students with smartphones. (c) Interpret the interval in context. (d) A school administrator says '95% of students have smartphones.' Is this consistent with your interval? Explain. (e) What sample size would you need to cut the margin of error in half?

Practice with Prof. Nadia →

Curated Video Lessons

Confidence Intervals — AP Statistics
content

Confidence Intervals — AP Statistics

AP Stats Guy14 min
One-Sample t-Interval
content

One-Sample t-Interval

Khan Academy AP Stats11 min
Conditions for Inference
critical

Conditions for Inference

Starnes AP Stats10 min
🧪
UNIT 815-18%

Inference: Significance Tests

Expand ›

Key Topics

  • Four-step hypothesis test: Hypotheses → Conditions → Calculations → Conclusion (HCCC)
  • One-sample z-test for proportion; one-sample t-test for mean
  • Two-sample tests; chi-square goodness of fit and test of independence
  • Slope of regression line: t-test for β
  • P-value interpretation; Type I and Type II errors; power of a test

Key Terms

null hypothesis H₀
the default assumption — no effect, no difference
alternative hypothesis Hₐ
the claim being tested — what we're looking for evidence of
p-value
probability of getting results as extreme as observed, assuming H₀ is true
Type I error
rejecting H₀ when it is actually true (false positive)
Type II error
failing to reject H₀ when it is actually false (false negative)
power
probability of correctly rejecting a false H₀ (1 - P(Type II error))
Practice Prompt

A company claims that 40% of customers prefer their new product. A random sample of 200 customers shows 92 prefer it. (a) State the null and alternative hypotheses. (b) Check all conditions for a one-proportion z-test. (c) Calculate the test statistic and p-value. (d) Using α = 0.05, state your conclusion in context. (e) What type of error could you have made? Describe what it would mean in context.

Practice with Prof. Nadia →

Curated Video Lessons

Hypothesis Tests — AP Statistics Complete Guide
content

Hypothesis Tests — AP Statistics Complete Guide

AP Stats Guy16 min
P-Values and Conclusions
concept

P-Values and Conclusions

Khan Academy AP Stats12 min
Chi-Square Tests — AP Statistics
advanced

Chi-Square Tests — AP Statistics

Starnes AP Stats13 min
Honors Assessment

Three Assessment Types

Honors Statistics assessments reward statistical communication — defining parameters, checking conditions, and writing conclusions in context — not just correct calculations.

Get Help →
🔬

Statistical Investigation

Design a study or experiment, collect or analyze data, and present findings with statistical reasoning and appropriate displays.

Scoring Criteria
Research question is clearly defined and answerable with data
Appropriate sampling or experimental design selected and justified
Data summaries include context (variable name, units, population)
Conclusion addresses the original question with statistical evidence
📊

Data Analysis Report

Analyze a provided dataset using exploratory techniques, probability, or inference — and communicate findings in written form.

Scoring Criteria
Distributions described using SOCS framework with context
Graphical displays are accurate, labeled, and support the narrative
Statistical measures computed correctly with interpretation in context
Comparison language used when analyzing two or more groups
🎯

Inference Justification

Conduct a full confidence interval or significance test using the four-step HCCC framework, with complete written justification.

Scoring Criteria
Parameter defined in words before any calculation begins
All conditions checked explicitly with justification for each
Correct procedure identified, formula shown, calculation accurate
Conclusion written in context with direction of claim and significance level
Curated for Mastery

Practice & Reference Resources

🏛
OFFICIALFREE

CollegeBoard AP Statistics

Official CED, sample FRQs, and scoring guidelines.

Open resource
📂
OFFICIALFREE

Past AP Statistics FRQs (1997–2024)

Every past FRQ and scoring rubric. Practice Part A in 13-minute blocks, Part B in 25 minutes.

Open resource
🎥
HIGHLY RECOMMENDEDFREE

AP Stats Guy (Josh Tabor)

Co-author of the Starnes/Tabor textbook. Excellent video explanations of every topic and FRQ strategy.

Open resource
🎯
FREE PRACTICEFREE

Khan Academy AP Statistics

Full AP Statistics course with practice problems organized by unit. Great for checking understanding.

Open resource
📚
COMPREHENSIVEFREE

Fiveable AP Statistics

Unit summaries, FRQ practice, and live cram sessions before the May exam.

Open resource
📖
TEXTBOOK

The Practice of Statistics (Starnes & Tabor)

The official AP Statistics textbook. Read the Technology Corners for calculator tips.

Open resource
🚀
REFERENCEFREE

Stat Trek

Quick reference for probability rules, distributions, and calculator steps. Excellent as a formula cheat sheet.

Open resource
📝
PRACTICE MCQ

Albert.io AP Statistics

AP-style multiple choice practice covering all 4 main units.

Open resource
Prof. Nadia's Playbook

Six Success Tips

💬

Context every answer: never write a bare number. 'The mean is 42 minutes' is correct. 'The mean is 42' earns no credit.

📋

Use SOCS for every distribution description — Shape, Outliers, Center, Spread — in that order, every time.

✅

Check conditions explicitly before every inference procedure. Random? Normal? Independent? Write them out.

🔤

Define your parameter in words before stating hypotheses. 'Let p = the true proportion of all seniors who…'

📈

Sketch the Normal curve when solving probability problems — it helps you verify whether your answer is reasonable.

🔍

Review every missed problem by asking two questions: Was my error conceptual or procedural? What's the correct reasoning?

AI-Powered Progress

16-Week Honors Study Plan

Weeks 1–4

Phase 1: Exploring Data and Collecting Data

  • Master SOCS framework until it becomes automatic for every distribution description
  • Practice drawing and interpreting boxplots, histograms, scatterplots daily
  • Study design: practice identifying confounding variables in 5 studies per week
  • Written analysis: 2 data description write-ups per week — check for context in every sentence
Weeks 5–8

Phase 2: Probability and Sampling Distributions

  • Master binomial and geometric distribution formulas cold
  • Practice sampling distribution problems with Central Limit Theorem applications
  • Two probability analysis problems per week with full work shown
  • Calculator drills: normalcdf, invNorm, binomcdf, binompdf — master each
Weeks 9–12

Phase 3: Inference — Confidence Intervals and Tests

  • Complete all inference types: z-test, t-test, chi-square, regression slope
  • Master the four-step HCCC format until it becomes automatic
  • One complete inference problem per day — check conditions every time
  • Peer review sessions: swap written justifications and evaluate each other's reasoning
Weeks 13–16

Phase 4: Statistical Investigation and Portfolio

  • Design and complete a full Statistical Investigation project from question to conclusion
  • Compile a Data Analysis Portfolio — one polished report per unit
  • Review every missed problem — identify if the error is conceptual or procedural
  • Final sessions with Prof. Nadia (SofAI): oral explanation of your reasoning — the highest form of understanding
Next Steps

Related Courses

📊
Advanced Placement

AP Statistics

Take the AP version for college credit potential, the AP exam, and a Score 5 target with FRQ mastery.

Explore AP Statistics →
∫
Mathematics

AP Calculus AB

Pair Statistics with Calculus to build a complete mathematical foundation for college STEM.

Explore AP Calculus AB →
🎓
AP Capstone

AP Seminar

Statistics builds exactly the evidence-based argumentation and quantitative reasoning AP Seminar demands.

Explore AP Seminar →
Agentic AI Tutoring

Your Honors Statistics AI Tutor

Prof. Nadia Osei is your Statistics expert — every data analysis, probability problem, and inference procedure. SofAIconnects Statistics to every other subject you're studying.

🎯 Walk me through the four-step inference framework with a real example📋 I always forget to check conditions — help me master them for every test type📊 Give me a data analysis practice problem and guide me through SOCS⚖️ What is the difference between a confidence interval and a p-value?
📊

Ready to Master Honors Statistics?

Enroll in the most comprehensive, AI-powered Honors Statistics course available. WASC accredited. UC A-G Section C approved. Honors credit.

Browse All Courses

WASC Accredited · UC A-G Approved · Honors Course · UC A-G Section C

Financial literacy should belong to everyone

Help California students build money confidence.

Give to the endowment →Open financial literacy hub
VR
The VR School

The world's first accredited Spatial Intelligence school. WASC-accredited. UC A-G approved. 402+ students. 20+ countries.

520 Lasuen Mall #200, Stanford, California, CA 94309
(650) 422 9180
admissions@thevrschool.org
WASC Accredited

Fully Accredited for Grades 6–12 by ACS WASC

Code: 43 46070 999Grades 6–12

World Labs Partner ✦

Spatial Intelligence · Marble · Spark.js

School

  • About Us
  • Staff
  • Accreditation
  • School Profile
  • Endowment
  • Corporate Giving
  • Careers

Programs

  • UC A-G Courses
  • California Personal Finance
  • CVC Dual Enrollment
  • CVC Pathway OS
  • iBuildme
  • iBuildme App
  • iTeachXR LMS
  • AP Seminar Studio
  • Credentials
  • AI Program
  • VR Labs
  • VR Experiences
  • VR Network

Spatial Intelligence

  • Spatial Lab ✦
  • Moonshots TV
  • World Labs Marble ↗
  • The School That Shouldn't Exist
  • Website Evolution Archive
  • Media & Stories
  • VR Explorer

Support

  • Help & Support
  • Contact
  • Blog
  • Headset Safety
  • Privacy Policy
  • Terms of Service

© 2026 The VR School · All rights reserved · Spatial Intelligence Lab ✦

402+ students · Stanford · Palo Alto · China · Singapore

91% Math · 89% Science · 86% ELA · WASC · UC A-G