The VR School
Financial LiteracyGive
Enroll
STAT
All Courses
AP ExamUC A-G · Section CUC Honors · +1.0 GPAMay 15, 2026

AP Statistics
Think With Data

AP Stats: Data, Inference, Decisions

The most comprehensive agentic AP Statistics course. From exploring data to statistical inference — master every FRQ type, ace every rubric point, and score a 5 — guided by Prof. Nadia Osei and SofAI.

Start with Prof. Nadia
AP Resources
5
Score Target
Quick LinksCollegeBoard AP Statistics VRS AP Resources AP Seminar Exemplar ↗
Exam: May 15, 2026
Exam Blueprint

Four Section Types · MC + FRQ

🔵

Multiple Choice

Section I
50%90 min40 questions
  • › Tests all 4 units: exploring data, study design, probability, inference
  • › ~60% conceptual understanding, ~40% computation
  • › Calculator required — TI-84 or equivalent

Score 5 Tip: For every MC question, ask: is this a probability question or an inference question? That determines your formula. Also — 'which is the best design?' questions always choose the randomized comparative experiment.

🟣

Short FRQ

Section II · Part A
37.5%65 min5 FRQs
  • › 5 short FRQs worth roughly equal points
  • › Topics cycle across all 4 units — expect one on inference, one on data analysis, one on probability
  • › Must show work AND write interpretation in context

Score 5 Tip: Never write a statistic without context. 'The mean is 42' earns 0 points. 'The mean commute time is 42 minutes' earns the point. Context is the #1 way AP Stats graders distinguish 5s from 4s.

🟠

Investigative Task

Section II · Part B
12.5%25 min1 complex FRQ
  • › Multi-part problem requiring synthesis of multiple statistical concepts
  • › Often involves a new type of analysis students haven't seen before — read carefully
  • › Must show complete reasoning — partial credit awarded throughout

Score 5 Tip: The Investigative Task is designed to reward statistical thinking, not formula memorization. When you see an unfamiliar situation, connect it to the closest concept you know and show your reasoning step-by-step.

🟡

Data Exploration & Probability

Units 1 + 3 (50% of exam)
~50%Distributed across both sectionsBoth MC and FRQ
  • › Unit 1: Describe distributions (shape, center, spread, outliers — use SOCS)
  • › Unit 3: P(A or B), P(A and B), conditional probability, binomial, geometric, sampling distributions
  • › Central Limit Theorem: sampling distribution of x̄ is approximately Normal when n ≥ 30

Score 5 Tip: For any distribution description, use SOCS: Shape (symmetric/skewed/bimodal), Outliers (name them), Center (mean or median), Spread (range, IQR, SD). Write it in that order every time.

Score Distribution (2024)

Where Students Land

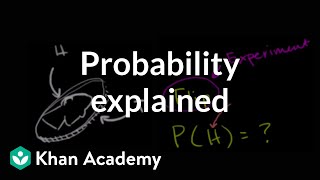
~230,000 students take AP Statistics annually. The exam rewards clear communication and statistical reasoning over computation speed.

5
Extremely Qualified
← Your target16%
4
Well Qualified
21%
3
Qualified
22%
2
Possibly Qualified
20%
1
No Recommendation
21%

Score 5 Roadmap

Your point targets for the May 15 exam

🔵

MC Target: ≥ 75% (~30 of 40 questions)

📊

Short FRQ Target: Full HCCC format every inference question

🔬

Investigative Task: Show all work even when uncertain

✏️

Communication: Write every answer in context — never just a number

CollegeBoard CED Aligned

Eight AP Statistics Units

📊
UNIT 115-23%

Exploring One-Variable Data

Expand ›

Key Topics

  • Categorical vs. quantitative variables
  • Describing distributions: shape, center, spread, outliers (SOCS)
  • Measures of center: mean, median; measures of spread: range, IQR, standard deviation
  • Boxplots, histograms, dotplots, stemplots; comparing distributions

Key Terms

distribution
pattern of values: shape, center, spread of a variable
IQR
interquartile range = Q3 - Q1 (middle 50% spread)
outlier
value more than 1.5×IQR beyond Q1 or Q3
skewed right
tail extends to the right; mean > median
standard deviation
typical distance of values from the mean
z-score
number of standard deviations a value is from the mean: z = (x - μ)/σ
FRQ Practice Prompt

A dataset shows commute times (in minutes) for 20 workers: 12, 15, 18, 20, 20, 22, 25, 25, 28, 30, 30, 32, 35, 40, 45, 50, 55, 60, 75, 90. Calculate the mean, median, Q1, Q3, and IQR. Identify any outliers. Describe the distribution using SOCS. Would you use mean or median to describe center? Justify.

Practice with Prof. Nadia →

Curated Video Lessons

Describing Distributions — AP Statistics
content

Describing Distributions — AP Statistics

Starnes AP Stats12 min
Boxplots and Histograms
visual

Boxplots and Histograms

Khan Academy10 min
Mean vs. Median — When to Use Which
concept

Mean vs. Median — When to Use Which

AP Stats Guy8 min
📈
UNIT 25-7%

Exploring Two-Variable Data

Expand ›

Key Topics

  • Scatterplots: direction, form, strength, outliers
  • Correlation coefficient r: strength and direction (-1 to 1)
  • Least-squares regression line: ŷ = a + bx
  • Residuals = observed - predicted; residual plots for linearity check
  • Influential points vs. outliers in regression

Key Terms

correlation (r)
measures strength and direction of linear association (-1 to 1)
least-squares regression
line that minimizes sum of squared residuals
residual
observed y minus predicted ŷ
extrapolation
predicting outside the range of data (unreliable)
lurking variable
third variable causing the association between two others
coefficient of determination r²
% of variation in y explained by linear relationship with x
FRQ Practice Prompt

A researcher finds r = 0.87 between hours studied and test score. Write 3 correct interpretations of this r value. Then: what is r²? What does it mean in context? If the LSRL is ŷ = 42 + 5.3x (where x = hours studied), predict the test score for a student who studied 8 hours. A student studied 8 hours and scored 78. Calculate and interpret their residual.

Practice with Prof. Nadia →

Curated Video Lessons

Scatterplots and Correlation
content

Scatterplots and Correlation

AP Stats Guy11 min
LSRL — Least Squares Regression
content

LSRL — Least Squares Regression

Khan Academy AP Stats13 min
Residuals and Residual Plots
application

Residuals and Residual Plots

Starnes AP Stats9 min
🔬
UNIT 312-18%

Collecting Data

Expand ›

Key Topics

  • Census vs. sample; sampling methods (SRS, stratified, cluster, systematic)
  • Sources of bias: voluntary response, convenience, undercoverage, nonresponse
  • Observational studies vs. experiments
  • Experimental design: treatments, control, random assignment, placebo, double-blind
  • Confounding variables and how to control them

Key Terms

SRS
simple random sample — every individual has equal chance of selection
stratified random sample
divide into strata, then SRS from each stratum
confounding variable
variable that is related to both the explanatory and response variables
control group
group that receives no treatment (or placebo)
random assignment
randomly assigning subjects to treatments — eliminates confounding
double-blind
neither subjects nor evaluators know who received which treatment
FRQ Practice Prompt

A school wants to know if students prefer online or in-person learning. (a) Describe how to conduct a stratified random sample by grade level with n=120. (b) A student suggests using a voluntary response survey posted on the school website. Explain two sources of bias this introduces. (c) Design a randomized comparative experiment to test whether online tutoring improves test scores compared to in-person tutoring. Include: subjects, treatments, random assignment, and response variable.

Practice with Prof. Nadia →

Curated Video Lessons

Sampling Methods — AP Statistics
content

Sampling Methods — AP Statistics

AP Stats Guy12 min
Experimental Design
content

Experimental Design

Khan Academy AP Stats11 min
Bias in Surveys — AP Stats
application

Bias in Surveys — AP Stats

Starnes AP Stats8 min
🎲
UNIT 410-20%

Probability

Expand ›

Key Topics

  • Basic probability rules: P(Aᶜ), P(A or B) = P(A) + P(B) - P(A and B)
  • Conditional probability: P(A|B) = P(A and B)/P(B)
  • Independent vs. mutually exclusive events
  • Venn diagrams and two-way tables
  • Law of Large Numbers and the Multiplication Rule

Key Terms

sample space
set of all possible outcomes
complement
P(Aᶜ) = 1 - P(A)
mutually exclusive
events that cannot both occur: P(A and B) = 0
independent events
P(A|B) = P(A): knowing B doesn't change probability of A
conditional probability
P(A|B) = P(A and B) / P(B)
Bayes' theorem
P(A|B) = P(B|A)·P(A) / P(B)
FRQ Practice Prompt

In a survey of 200 students, 120 play a sport and 80 are in band. 40 do both. (a) Create a two-way table. (b) Find P(Sport and Band), P(Sport or Band), P(Sport|Band), P(Band|Sport). (c) Are playing a sport and being in band independent? Show your work mathematically. (d) If 3 students are randomly selected without replacement, what is the probability all 3 play a sport?

Practice with Prof. Nadia →

Curated Video Lessons

Probability Rules — AP Statistics
content

Probability Rules — AP Statistics

AP Stats Guy10 min
Conditional Probability and Independence
content

Conditional Probability and Independence

Khan Academy AP Stats12 min
Two-Way Tables and Conditional Probability
practice

Two-Way Tables and Conditional Probability

Starnes AP Stats9 min
📉
UNIT 57-12%

Random Variables and Probability Distributions

Expand ›

Key Topics

  • Discrete random variables: mean (μ), standard deviation (σ)
  • Continuous random variables and the Normal distribution
  • Binomial distribution: n trials, probability p of success, X ~ B(n,p)
  • Geometric distribution: number of trials until first success
  • Linear combinations of random variables: E(aX + b), Var(aX + b)

Key Terms

expected value E(X)
mean of a probability distribution: Σx·P(x)
binomial distribution
counts successes in fixed n independent trials with constant p
geometric distribution
counts trials until first success
Normal distribution
symmetric bell curve defined by μ and σ
standardizing
z = (X - μ)/σ — converts to standard normal
10% condition
sample < 10% of population — allows treating as independent
FRQ Practice Prompt

A student guesses on a 10-question true/false quiz. Let X = number correct. (a) Describe the distribution of X. (b) Find P(X ≥ 7). (c) Find the mean and standard deviation of X. (d) Now assume the quiz has 100 questions. What is the approximate probability the student gets more than 60 correct? Use the Normal approximation (check conditions first).

Practice with Prof. Nadia →

Curated Video Lessons

Discrete Random Variables — Expected Value
content

Discrete Random Variables — Expected Value

AP Stats Guy11 min
Binomial Distribution — AP Statistics
content

Binomial Distribution — AP Statistics

Khan Academy AP Stats14 min
Normal Distributions and Z-Scores
visual

Normal Distributions and Z-Scores

Starnes AP Stats12 min
📐
UNIT 67-12%

Sampling Distributions

Expand ›

Key Topics

  • Sampling distribution of x̄: mean = μ, SD = σ/√n
  • Central Limit Theorem: x̄ approximately Normal when n ≥ 30
  • Sampling distribution of p̂: mean = p, SD = √(p(1-p)/n)
  • When to use z vs. t: known σ → z; unknown σ (use s) → t
  • Standard error vs. standard deviation

Key Terms

sampling distribution
distribution of a statistic over all possible samples of same size
Central Limit Theorem
x̄ is approximately Normal for large n, regardless of population shape
standard error
standard deviation of a sampling distribution
p̂ (p-hat)
sample proportion = count of successes / n
unbiased estimator
statistic whose mean equals the population parameter
variability
spread of a sampling distribution — decreases as n increases
FRQ Practice Prompt

The heights of adult women are Normally distributed with μ = 64 inches and σ = 2.8 inches. (a) What is the probability that one randomly selected woman is taller than 67 inches? (b) What is the sampling distribution of x̄ for samples of size n = 25? (c) What is the probability that the mean height of 25 women exceeds 65 inches? (d) If instead of height, we measured a heavily skewed variable (income), would the CLT still apply for n = 25? For n = 100? Explain.

Practice with Prof. Nadia →

Curated Video Lessons

Sampling Distributions — AP Statistics
content

Sampling Distributions — AP Statistics

AP Stats Guy13 min
Central Limit Theorem
concept

Central Limit Theorem

Khan Academy AP Stats10 min
Standard Error vs. Standard Deviation
clarification

Standard Error vs. Standard Deviation

Starnes AP Stats8 min
🎯
UNIT 712-15%

Inference: Confidence Intervals

Expand ›

Key Topics

  • Confidence interval structure: statistic ± critical value × SE
  • One-sample z-interval for proportion; one-sample t-interval for mean
  • Two-sample intervals: comparing two groups
  • Interpreting: 'We are 95% confident that the true [parameter] is between...'
  • Conditions: Random, Normal/Large Sample, Independence (10% condition)

Key Terms

confidence interval
range of plausible values for a population parameter
confidence level
probability that the interval captures the true parameter in repeated sampling
margin of error
critical value × standard error
critical value
z* or t* corresponding to desired confidence level
t-distribution
used when σ is unknown; heavier tails than Normal
degrees of freedom
df = n - 1 for one-sample t; determines t* value
FRQ Practice Prompt

A random sample of 50 students showed that 34 have a smartphone. (a) Check all conditions for a one-proportion z-interval. (b) Calculate a 95% confidence interval for the true proportion of students with smartphones. (c) Interpret the interval in context. (d) A school administrator says '95% of students have smartphones.' Is this consistent with your interval? Explain. (e) What sample size would you need to cut the margin of error in half?

Practice with Prof. Nadia →

Curated Video Lessons

Confidence Intervals — AP Statistics
content

Confidence Intervals — AP Statistics

AP Stats Guy14 min
One-Sample t-Interval
content

One-Sample t-Interval

Khan Academy AP Stats11 min
Conditions for Inference
critical

Conditions for Inference

Starnes AP Stats10 min
🧪
UNIT 815-18%

Inference: Significance Tests

Expand ›

Key Topics

  • Four-step hypothesis test: Hypotheses → Conditions → Calculations → Conclusion (HCCC)
  • One-sample z-test for proportion; one-sample t-test for mean
  • Two-sample tests; chi-square goodness of fit and test of independence
  • Slope of regression line: t-test for β
  • P-value interpretation; Type I and Type II errors; power of a test

Key Terms

null hypothesis H₀
the default assumption — no effect, no difference
alternative hypothesis Hₐ
the claim being tested — what we're looking for evidence of
p-value
probability of getting results as extreme as observed, assuming H₀ is true
Type I error
rejecting H₀ when it is actually true (false positive)
Type II error
failing to reject H₀ when it is actually false (false negative)
power
probability of correctly rejecting a false H₀ (1 - P(Type II error))
FRQ Practice Prompt

A company claims that 40% of customers prefer their new product. A random sample of 200 customers shows 92 prefer it. (a) State the null and alternative hypotheses. (b) Check all conditions for a one-proportion z-test. (c) Calculate the test statistic and p-value. (d) Using α = 0.05, state your conclusion in context. (e) What type of error could you have made? Describe what it would mean in context.

Practice with Prof. Nadia →

Curated Video Lessons

Hypothesis Tests — AP Statistics Complete Guide
content

Hypothesis Tests — AP Statistics Complete Guide

AP Stats Guy16 min
P-Values and Conclusions
concept

P-Values and Conclusions

Khan Academy AP Stats12 min
Chi-Square Tests — AP Statistics
advanced

Chi-Square Tests — AP Statistics

Starnes AP Stats13 min
50% of Total Score

FRQ Mastery Suite

AP Statistics FRQs reward communication, not computation. The rubric gives points for defining parameters, checking conditions, and writing conclusions in context — not just the right calculation.

FRQ Coach →
📊~37.5% total
Section II · Part A

Data Analysis Short FRQ

Part A · Most Frequent · ~13 min each

Describe, compare, or calculate from a dataset. May involve histogram, boxplot, scatterplot, or table.

Scoring Criteria
· SOCS: describes Shape, Outliers, Center, Spread for any distribution
· Context: every numerical answer mentions the variable name and units
· Comparison: uses comparative language ('the mean for Group A is higher than...')
· Calculation: shows work and includes units in final answer
Score 5 Strategy
For distribution descriptions: ALWAYS use SOCS in order
For comparisons: ALWAYS use comparative language — 'Group A has a higher median than Group B'
NEVER give a statistic without its context — the variable name must appear in every interpretation
Check: is this asking for an estimate or an exact calculation? Read the verb carefully
Model Opener

The distribution of [variable] for [context] is [shape] with a center of approximately [median/mean] [units]. The spread, as measured by IQR, is [value] [units]. There [are/are no] potential outliers at [value(s)].

🎲~37.5% total
Section II · Part A

Probability and Random Variables FRQ

Part A · Calculation Heavy · ~13 min each

Calculate probability using rules, distributions, or simulation. Identify the distribution and check conditions.

Scoring Criteria
· Distribution identification: names the correct distribution (Binomial, Normal, Geometric)
· Conditions: explicitly checks and verifies each condition
· Calculation: shows correct formula and arithmetic
· Interpretation: states probability in context
Score 5 Strategy
Name the distribution before calculating — say 'X follows a Binomial distribution with n = 20 and p = 0.3'
Check conditions explicitly — don't assume the grader knows you checked them
Show all calculator syntax or formula work even if you use a calculator
Interpret your answer: 'There is a 0.234 probability that...[context]'
Model Opener

Let X = [description]. X follows a [distribution] distribution with [parameters]. Conditions: [check each]. P(X [comparison]) = [calculation] = [answer]. There is a [probability] chance that [context interpretation].

🎯~37.5% total
Section II · Part A

Inference FRQ (Confidence Interval or Significance Test)

Part A · Rubric-Driven · ~13 min each

Conduct a full hypothesis test or construct a confidence interval. Must follow 4-step HCCC format.

Scoring Criteria
· H: Hypotheses stated in symbols and words, with parameter defined
· C: All conditions checked explicitly with justification
· C: Correct calculation with formula, values substituted, and result
· C: Conclusion in context with direction of Hₐ, p-value, and α level
Score 5 Strategy
ALWAYS define your parameter: 'Let p = the true proportion of [population] who [condition]'
Check 3 conditions: Random (stated in problem), Normal (np ≥ 10 and n(1-p) ≥ 10), Independent (10% condition)
Write your conclusion as: 'Because p-value [< or ≥] α = [value], we [reject/fail to reject] H₀. There [is/is not] sufficient evidence that [Hₐ in words] for [population]'
Fail to reject ≠ accept. Never say 'we accept H₀'
Model Opener

H₀: [parameter] = [value]; Hₐ: [parameter] [</>/≠] [value], where [parameter] = the true [description] of all [population]. Check conditions: Random ✓ (stated), Normal ✓ (np = [value] ≥ 10 and n(1-p) = [value] ≥ 10), Independent ✓ ([sample size] < 10% of all [population]).

🔬12.5%
Section II · Part B

Investigative Task

Part B · Synthesis · 25 min

Multi-part problem requiring connecting 2+ statistical concepts. Often involves unfamiliar scenarios that require reasoning beyond memorized procedures.

Scoring Criteria
· Communication: complete sentences, all answers in context
· Reasoning: explicit explanation of WHY a method was chosen
· Synthesis: connects two different statistical ideas correctly
· Extends: applies known concepts to a novel situation correctly
Score 5 Strategy
Read the ENTIRE task before answering any part — parts often build on each other
For unfamiliar setups, ask: 'What statistical concept is this similar to?'
Show ALL reasoning — partial credit is generous, but only if work is shown
If stuck on a later part, write: 'Assuming [value from previous part], I would...' and continue
Model Opener

Based on [data/context], I would use [method] because [justification]. The [statistic] is [value], which means [interpretation in context]. This is consistent/inconsistent with [comparison] because [reasoning].

Curated for Score 5

Practice Tests & Resources

🏛
OFFICIALFREE

CollegeBoard AP Statistics

Official CED, sample FRQs, and scoring guidelines.

Open resource
📂
OFFICIALFREE

Past AP Statistics FRQs (1997–2024)

Every past FRQ and scoring rubric. Practice Part A in 13-minute blocks, Part B in 25 minutes.

Open resource
🎥
HIGHLY RECOMMENDEDFREE

AP Stats Guy (Josh Tabor)

Co-author of the Starnes/Tabor textbook. Excellent video explanations of every topic and FRQ strategy.

Open resource
🎯
FREE PRACTICEFREE

Khan Academy AP Statistics

Full AP Statistics course with practice problems organized by unit. Great for checking understanding.

Open resource
📚
COMPREHENSIVEFREE

Fiveable AP Statistics

Unit summaries, FRQ practice, and live cram sessions before the May exam.

Open resource
📖
TEXTBOOK

The Practice of Statistics (Starnes & Tabor)

The official AP Statistics textbook. Read the Technology Corners for calculator tips.

Open resource
🚀
REFERENCEFREE

Stat Trek

Quick reference for probability rules, distributions, and calculator steps. Excellent as a formula cheat sheet.

Open resource
📝
PRACTICE MCQ

Albert.io AP Statistics

AP-style multiple choice practice covering all 4 main units.

Open resource
AI-Powered Progress

16-Week Score 5 Study Plan

Weeks 1–4

Phase 1: Exploring Data and Collecting Data

  • Master SOCS framework until it becomes automatic for every distribution description
  • Practice drawing and interpreting boxplots, histograms, scatterplots daily
  • Study design: practice identifying confounding variables in 5 studies per week
  • FRQ practice: 2 data description FRQs per week — grade using official rubric
Weeks 5–8

Phase 2: Probability and Sampling Distributions

  • Master binomial and geometric distribution formulas cold
  • Practice sampling distribution problems with Central Limit Theorem applications
  • FRQ practice: 2 probability FRQs per week with full work shown
  • Calculator drills: normalcdf, invNorm, binomcdf, binompdf — master each
Weeks 9–12

Phase 3: Inference — Confidence Intervals and Tests

  • Complete all inference types: z-test, t-test, chi-square, regression slope
  • Master the 4-step HCCC format until it's muscle memory
  • FRQ practice: one complete inference problem per day — check conditions every time
  • Complete 3 full practice exams (90 min MC + 90 min FRQ) timed
Weeks 13–16

Phase 4: Investigative Tasks and Full Exam Simulation

  • Solve 5 past Investigative Tasks (Part B) under 25-minute time limits
  • One full practice exam per week with detailed answer review
  • Review every missed MC question — identify if it's conceptual or procedural error
  • Final review with Prof. Nadia (SofAI): FRQ oral practice — explain your reasoning aloud
Official & Curated

AP Resources Hub

🏛
Official Source

CollegeBoard AP Statistics

Official course description, exam format, sample questions, and scoring guidelines.

Visit AP Central →
📚
The VR School

VRS AP Resources Center

All VR School AP course resources, study guides, and score submission guidance.

Open AP Resources →
⭐
Student Exemplar

AP Seminar Exemplar by Jiang

See the standard every VRS student aspires to — and the path to getting there.

View Exemplar →
Agentic AI Tutoring

Your Score 5 AI Tutors

Prof. Nadia Osei is your AP Statistics expert — every FRQ, scoring rubric, and exam strategy. SofAIconnects Statistics to every other subject you're studying.

🎯 Walk me through the 4-step HCCC hypothesis test format with an example📋 I always forget to check conditions — help me master the conditions for every inference test🔬 Give me a practice Investigative Task and grade my work⚖️ What's the difference between Type I and Type II error and when does each matter?
🌟 Next Level

Your Statistics Skills Are an Academic Superpower — Use Them in AP Seminar

AP Statistics builds exactly the skills AP Seminar demands: evidence-based argumentation, data analysis, and quantitative reasoning. See how Jiang combined these disciplines to build an outstanding portfolio recognized at the national level.

View AP Seminar ExemplarExplore AP Seminar →
🎓
📊

Ready to Score a 5 in AP Statistics?

Enroll in the most comprehensive, AI-powered AP Statistics course available. WASC accredited. UC A-G Section C approved. Exam: May 15, 2026.

Browse All Courses

WASC Accredited · UC A-G Approved · CollegeBoard Aligned · Exam: May 15, 2026

Financial literacy should belong to everyone

Help California students build money confidence.

Give to the endowment →Open financial literacy hub
VR
The VR School

The world's first accredited Spatial Intelligence school. WASC-accredited. UC A-G approved. 402+ students. 20+ countries.

520 Lasuen Mall #200, Stanford, California, CA 94309
(650) 422 9180
admissions@thevrschool.org
WASC Accredited

Fully Accredited for Grades 6–12 by ACS WASC

Code: 43 46070 999Grades 6–12

World Labs Partner ✦

Spatial Intelligence · Marble · Spark.js

School

  • About Us
  • Staff
  • Accreditation
  • School Profile
  • Endowment
  • Corporate Giving
  • Careers

Programs

  • UC A-G Courses
  • California Personal Finance
  • CVC Dual Enrollment
  • CVC Pathway OS
  • iBuildme
  • iBuildme App
  • iTeachXR LMS
  • AP Seminar Studio
  • Credentials
  • AI Program
  • VR Labs
  • VR Experiences
  • VR Network

Spatial Intelligence

  • Spatial Lab ✦
  • Moonshots TV
  • World Labs Marble ↗
  • The School That Shouldn't Exist
  • Website Evolution Archive
  • Media & Stories
  • VR Explorer

Support

  • Help & Support
  • Contact
  • Blog
  • Headset Safety
  • Privacy Policy
  • Terms of Service

© 2026 The VR School · All rights reserved · Spatial Intelligence Lab ✦

402+ students · Stanford · Palo Alto · China · Singapore

91% Math · 89% Science · 86% ELA · WASC · UC A-G